I’ve been doing some form of digital marketing for over 6 years. I’ve done everything from affiliate management, lifecycle email campaigns, to PPC ads in Google, Facebook, LinkedIn, and more.
I’ve spent over $6 million dollars on Google Ads alone in a single year. And there’s one tool I can’t live without.
It helps digital marketers pull data from many different ad platforms, send it to Google sheets, and then pipe in revenue from Mysql, RedShift, or any number of places to create an automatically updated dashboard of your paid media performance.
Pretty cool, right? Here are a few things I’ve used Supermetrics to do:
- Build a consolidated paid media dashboard across Google, Bing, and Facebook
- Import revenue data from MySql and Redshift databases
- Process and send data on a recurring basis to bid management platforms
- Automate otherwise manual processes to save me hours every week.
I’ll cover the first point today and teach you how to use Supermetrics to build a Google Ads dashboard in google sheets. You can copy my template and expand on it however you like.
Before we get started, you’ll need two things.
Tools needed:
- Google sheets. Duh.
- Supermetrics for Google Sheets
They have a free plan that connects to just Google Analytics, but to harness the full power you’ll need a paid account . I may be able to help with a coupon code, so just send me an email.
Ok, let’s get started!
Start With Supermetrics
Supermetrics is a tool for the discerning, fast-moving digital marketer. It lets you pull data from a number of ad platforms or databases and dump it somewhere else.
The list of connections available through Supermetrics is staggering:
- Google Ads, Analytics, Adsense, & Search Console
- Microsoft Ads & Webmaster Tools
- Database (MySQL, redshift)
- Facebook Ads, Insights, & Public Data
- Quora, Reddit, & LinkedIn
- Moz, SEMrush
- A whole lot more
It’s essentially a SQL query for whatever data source you want.
Read my full Supermetrics review here.
The specific tool I use is Supermetrics for Google Sheets, which dumps the data you want into a Google sheet.
They have products for other tools as well:
I prefer Sheets over Excel for a few reasons:
- I can easily share reports or files with other people in my company
- It connects to tons of other services through Zapier
- Access my files from anywhere
Supermetrics has a free plan but you’re limited to Google Analytics data and you can’t schedule refreshes. Their paid plan right now starts at $100/month, paid annually, and is worth every freaking penny.
Building a Google Ads Dashboard
The Google Ads interface has evolved a lot over the years to better help users manage their campaigns. But it’s horrible for reporting on performance.
Every digital marketer I know downloads their data from Google Ads and throws it into a spreadsheet for analysis. The lucky ones have access to it in a data warehouse so they can slice and dice with expensive BI tools like Looker.
But development resources are expensive and time-consuming. What if you need to build that report tomorrow?
With Supermetrics you can download the data you need to be refreshed automatically every morning.
Let’s get started building that dashboard. Here are the charts I want to build, both weekly and for branded campaigns.
- Search Impression Share & Avg CPCs
- Total Conversions & CPA
1. Install the Supermetrics Google Sheets Addon
- Go here and install it for free
- Create a new google sheet, title it whatever you like
2. Connect Your Google Ads Account
In your new sheet, click Add-ons → Supermetrics → Launch Sidebar
It’ll look like this:
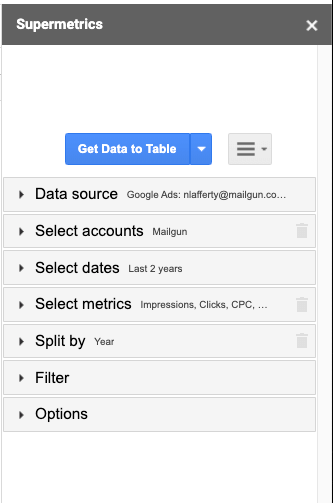
Click Data source → Google Ads
- You’ll be prompted to connect Supermetrics to your Ads account. This is necessary to pull data into your Google sheet.
Once you’re connected, open Select Accounts and pick the account you want. You can choose the MCC level account or specific ones if you want, depending on how you gave it access.
3. Pull Your Data
We’re going to build 2 charts, each by week. I like to pull 6 months of data when looking weekly. You can choose more or less depending on your needs.
- Absolute Top Search Impression Share & Average CPCs for Branded Campaigns
- Total Conversions & CPA
- Click Select Dates, choose last X Weeks, and enter 24. Your preference for Mon-Sun or Sun-Sat.
- Leave Include This Week unchecked, otherwise, you’ll get partial data for this week.
- Click Select metrics, and choose the following:
- Impressions, Clicks, CPC, Cost, Conversions, Conv Rate, Cost Per Conversion, Impression Share, Search Absolute Top Impression Percent
- We’re pulling more data in case we want to build other charts, and I like having it there for context and to spot check for problems
- Impressions, Clicks, CPC, Cost, Conversions, Conv Rate, Cost Per Conversion, Impression Share, Search Absolute Top Impression Percent
- Split to rows:
- Year & Week. Make sure to match the week preference from earlier.
- I like Week Year because it accounts for weeks that split the year, such as January or February will contain data from last November and December.
- Filter
- This depends on your setup, but I like to filter only my Search campaigns.
- Network: contains search
- Campaign name: contains Brand
- If your Brand campaigns are denoted a certain way, just filter on that.
- This depends on your setup, but I like to filter only my Search campaigns.
Ok, you’re ready! Click Get Data To Table and watch everything populate!
4. Schedule Automatic Refresh
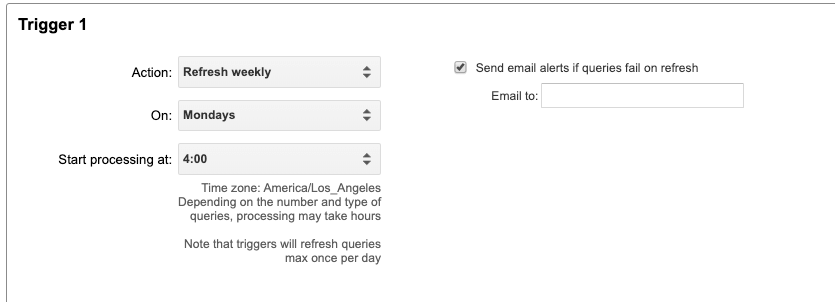
Before we build the charts, let’s schedule an automatic refresh so our data updates every week. Click Add-ons → Supermetrics → Schedule Refresh and Emailing.
Under Action, click Refresh Weekly. You can also choose Refresh & Email weekly, which will also email you the results. You can choose to have the result emailed in a PDF or Excel attachment, or inline CSV which is my preferred option.
I have the action start processing a few hours before I’ll ever need it, so here I selected 4 am.
Make sure to click Store Trigger at the bottom right, otherwise, it won’t be saved!
5. Build Your Charts
Time to build the charts in our sweet Google Ads Dashboard! If you haven’t already, rename the sheet with your data in it something like Raw Data, just to keep this organized.
Create a new sheet, called Charts.
Go back to your Raw Data sheet, and build your charts. I prefer to build them in this sheet, and then copy them over to a new sheet. You can do whatever you prefer.
First, we’ll build our Absolute Search Impression Share & Avg CPCs for Branded Campaigns
Highlight the full columns for:
- Week
- Search Absolute Top Impression Share
- CPC
Once your columns are highlighted, click Insert → Chart. You’ll get something that looks like this (I’ve fudged my numbers a bit for privacy).
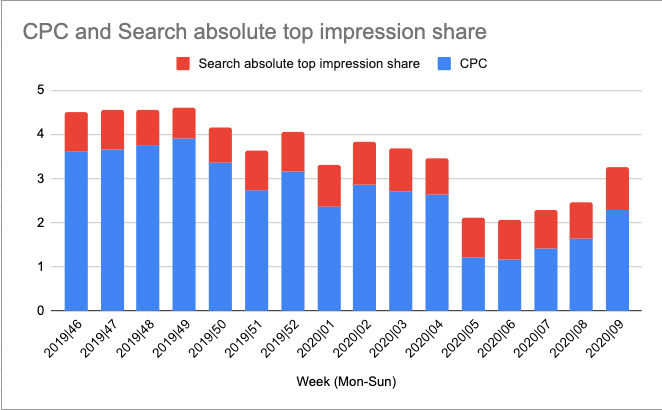
A decent start, but not readable. Double click your chart, then in the Chart Editor hit Setup → Chart type → Combo Chart (bar and line graph).
Go to Customize, and make sure Impression Share is on the left axis, and a bar graph and CPC is on the right axis and a line graph. You change these under Series. Also, you can choose to show the data labels to make your chart more readable.
It may help to format the numbers in your data too, so you get nice percents.
You should have something like this.
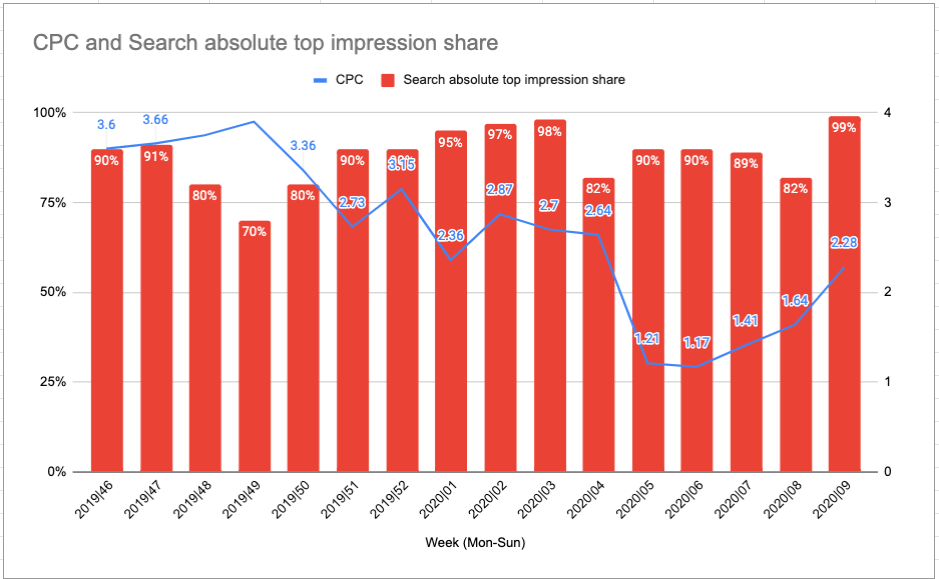
Great! This helps me keep an eye on my brand campaigns to stay ahead of any competitors trying to bid on my brand. Usually, if I see my CPCs increase it means someone is conquesting my brand, and I need to look into raising my bids to out price them (they’re likely paying 3-4x my CPCs) or file a trademark request if they’re using my brand in their ads.
Now we’ll do the same for the next graph, Total Conversions & CPA for branded campaigns.
Highlight the below columns:
- Week
- Conversions
- Cost Per Conversion
Create a chart in the same way, and you’ll get a familiar-looking result. Again, my numbers are fudged.
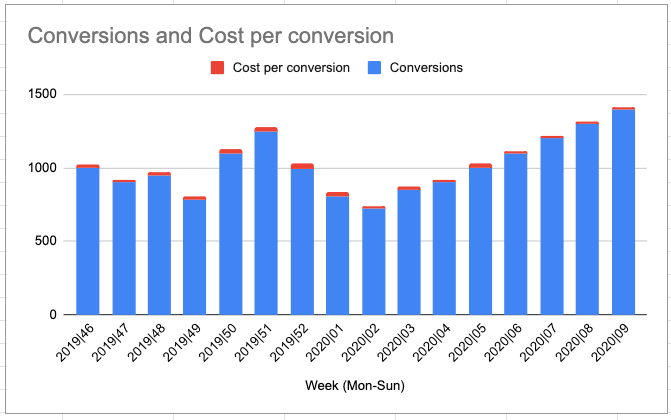
I made the same changes as the last one:
Switching to a combo chart
Formatting the numbers and displaying data labels
Moving Cost per Conversion to the right axis, and a line graph
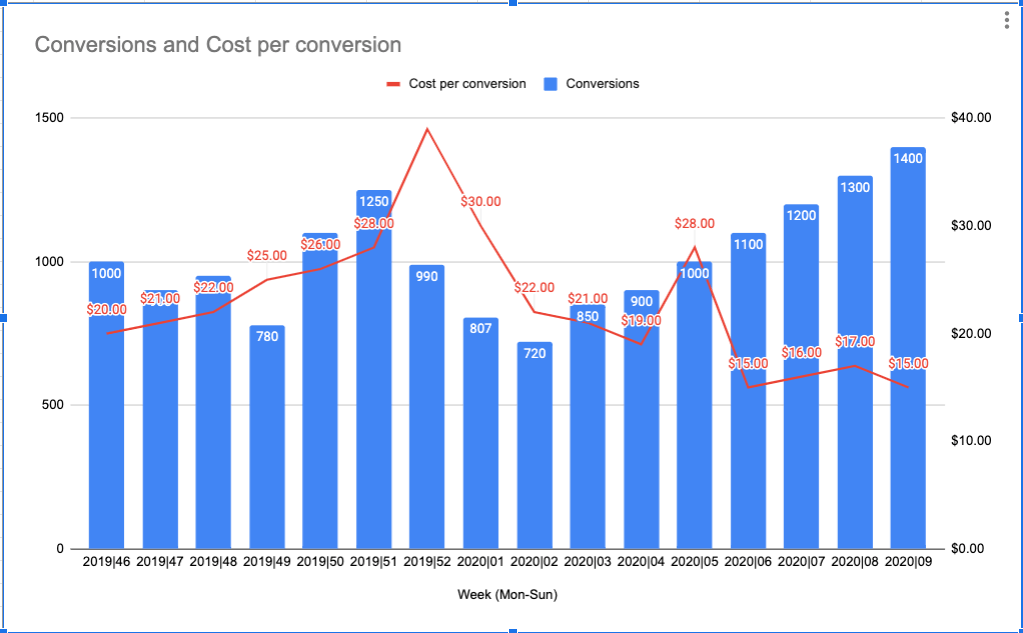
My fake company is crushing it! More conversions at a lower CPA.
Wrapping Up
That’s how you use Supermetrics to create a Google Ads dashboard in Google Sheets. Super simple to setup and the possibilities for expansion are limitless. If you want to bring in additional data sources, I’d recommend creating new tabs for each data source like Facebook Ads or Bing. Then you could Vlookup your relevant columns into one master raw data sheet, and build charts off those. That is how I build a weekly cost file across all my paid media channels.